Targeting Task Performance Metric

The validated logic of the original TTP metric

Experiment details are provided in the references.
In [1-3], three experienced observers viewed Air Force 3-bar charts to establish limiting resolution of image intensifiers versus chart illumination. The experiment used chart contrasts of 1.0 and 0.4. Data were collected with and without laser protective eyewear situated between the goggle and eye that reduced apparent luminance by a factor of ten. Light to the eye varied from as little as 3.4E-4 fL to 35 fL. Chart illuminance varied from 2.88E-6 to 3.39E-3-foot candles, and that variation in illumination means that the image varied from noise to resolution limited.

Professional targeting task performance validation metric dashboard chart

The figure below at left compares the original TTP PID predictions to data collected with various shape blurs, contrasts, and noise levels. The figures at right show predictions for colored noise. See [1-4].

The graphs below show predictions for characters, faces, and shapes. We are particularly impressed with predicting performance through spotting scopes and binoculars. The current modelers have thrown away the performance in the graphs above and below. Why?

Cir is Circle, Hex is Hexagon
Oct is Octagon

The next graph shows recognition of armored tracked versus armored wheeled versus wheeled trucks [3].

The next two graphs show field test results using tracked tactial vehicles. Details are in [3]. Field results are more accurate for reasons described in [25].

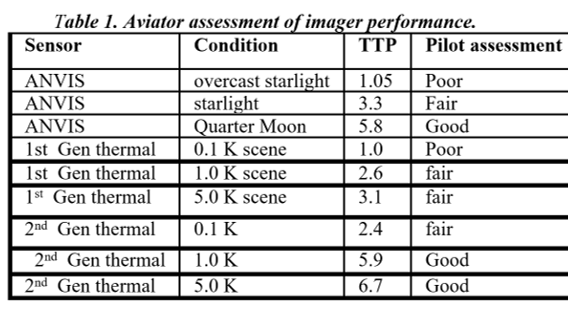
NVThermIP modeled thermal imagers and was part of a set of models that included an image intensifier model. Over the last forty years, Army aviators have flown with imager intensifiers (ANVIS) and both first and second generation thermal imagers [24]. The table shows TTP predictions for pilotage utility and the results of pilot surveys. TTP predicts aviator experience
with pilotage sensors. This data for the original TTP and not NVIPM.

Alaising has been treated wrong since I and others made a mistake in the first sampling experiments. I have not been able to get my coauthors to agree on the mistake, but the problem is obvious and the solution published [15,16]. It is not possible to believe that aliasing does not corrupt a picture, given any significant amount of alsising, that is.

In the picture below at top, a big blur is moved from the center of one pixel to the intersection of four pixels, and the display result changes little, At bottom, a small optical blur is moved and the change in display obvious. The idea that this behavior cannot affect PID is simply wrong. When and how much can be calculated using the algorithms in [15,16]. The incorrect model used in NVIPM is laeled EB and the correct model AAN. NC means no corection. The grpahs are exampes of TTP AAN prediction accuracy, and more examples are presented in [15,16].

Regardless of the many successful validation efforts, the Future Command modelers and their management (sic) have dropped the TTP metric. They have never provided any explanation other than a few words in NVIPM documentation where they present a misleading representation of facial PID data.
Scroll to Top